That beautifully branded photo wall—also known as a step and repeat or backdrop—at your next trade show or event isn't just a decoration; it's a lead magnet waiting to deliver real business results. The difference between a pretty display and a revenue-driving asset comes down to three things: strategic capture, smart tracking, and systematic follow-up.
Most businesses treat photo walls as pure branding exercises, missing the opportunity to turn every selfie into a measurable lead. But when you plan the right KPIs, set up proper tagging systems, and create simple workflows that connect those Instagram moments to your CRM, you can prove exactly what your wall delivered in pipeline terms.
This guide walks you through the complete measurement framework—from defining success metrics before you print to building dashboards that show real ROI numbers your CFO will actually care about.
Define Success Before You Print
Every successful photo wall campaign starts with one clear, measurable goal. Skip the laundry list of objectives and pick your primary target: email opt-ins, meeting bookings, trial signups, or donation commitments. Whatever you choose becomes your north star for design, messaging, and follow-up.
Set specific numeric targets broken down by day and staffing shift. If you're aiming for 200 qualified leads over three show days, that's roughly 67 per day, or about 8-10 per hour during peak traffic. These micro-targets help your booth team stay focused and give you early warning signals if something isn't working.
Map your success to one simple on-site action that visitors can complete in under 60 seconds. The most effective sequence follows this pattern: scan QR code → fill three-field form → receive immediate deliverable. The deliverable could be their photo, a buyer's guide download, calendar booking link, or contest entry. Keep it simple, valuable, and instant.
Resist the urge to add secondary conversion paths or multiple CTAs on your signage. Visitors make split-second decisions at busy events, and choice overload kills conversion rates faster than poor Wi-Fi.
The KPI Stack
Tracking photo wall performance requires a mix of traffic, conversion, and pipeline metrics. This table shows the essential KPIs and how to calculate them:
KPI
|
What it Measures
|
Quick Formula
|
|
Scans/Visits
|
Foot traffic to your link
|
Total QR/NFC hits
|
|
Lead Capture Rate
|
How well you convert visitors
|
Leads ÷ Visits
|
|
Qualified Conversations
|
Intent signal from booth chats
|
marked "qualified"
|
|
Meetings Booked
|
Real calendar commitments
|
scheduled on site
|
|
Share Rate
|
Social amplification
|
tagged shares ÷ Photos taken
|
|
MQL/SQL
|
Stage progression
|
MQLs/SQLs from event
|
|
Pipeline Created
|
Opportunities sourced
|
new opps from event
|
|
Time to First Touch
|
Speed to follow-up
|
Avg hours to outreach
|
Scans/Visits shows raw attraction power but means nothing without conversion context. A wall that gets 500 scans but only 20 leads has a fundamental messaging or user experience problem.
Lead Capture Rate reveals how well your offer resonates with visitors who showed initial interest. Rates below 25% suggest your form is too long, your value proposition is unclear, or your deliverable isn't compelling enough.
Pipeline Created connects your marketing spend to actual revenue opportunity, though you'll need 60-90 days post-event to see meaningful numbers here.
UTM & Link Taxonomy
Create one primary short link that redirects to your dedicated landing page, then use UTM parameters to segment traffic sources and measure performance by booth placement or design variant.
Your UTM structure should follow this consistent pattern:
- utm_source: eventname (ces2024, dreamforce, etc.)
- utm_medium: qr or nfc (depending on scan method)
- utm_campaign: photo-wall-2024 (campaign identifier)
- utm_content: v1, v2, v3 (for A/B testing different designs or messages)
- utm_term: booth-main, booth-side, day1, day2 (for location/timing analysis)
Resist the temptation to create multiple destination pages for different UTM variants. Keep one landing page and vary only the UTM parameters to simplify reporting and avoid fragmenting your conversion data. Most analytics platforms make it easy to segment performance by UTM values while maintaining clean, comparable metrics.
Test your complete UTM setup before show day. Nothing kills a campaign faster than broken tracking that you discover when 200 potential leads have already been lost to a redirect error.
Capture Methods That Actually Get Used
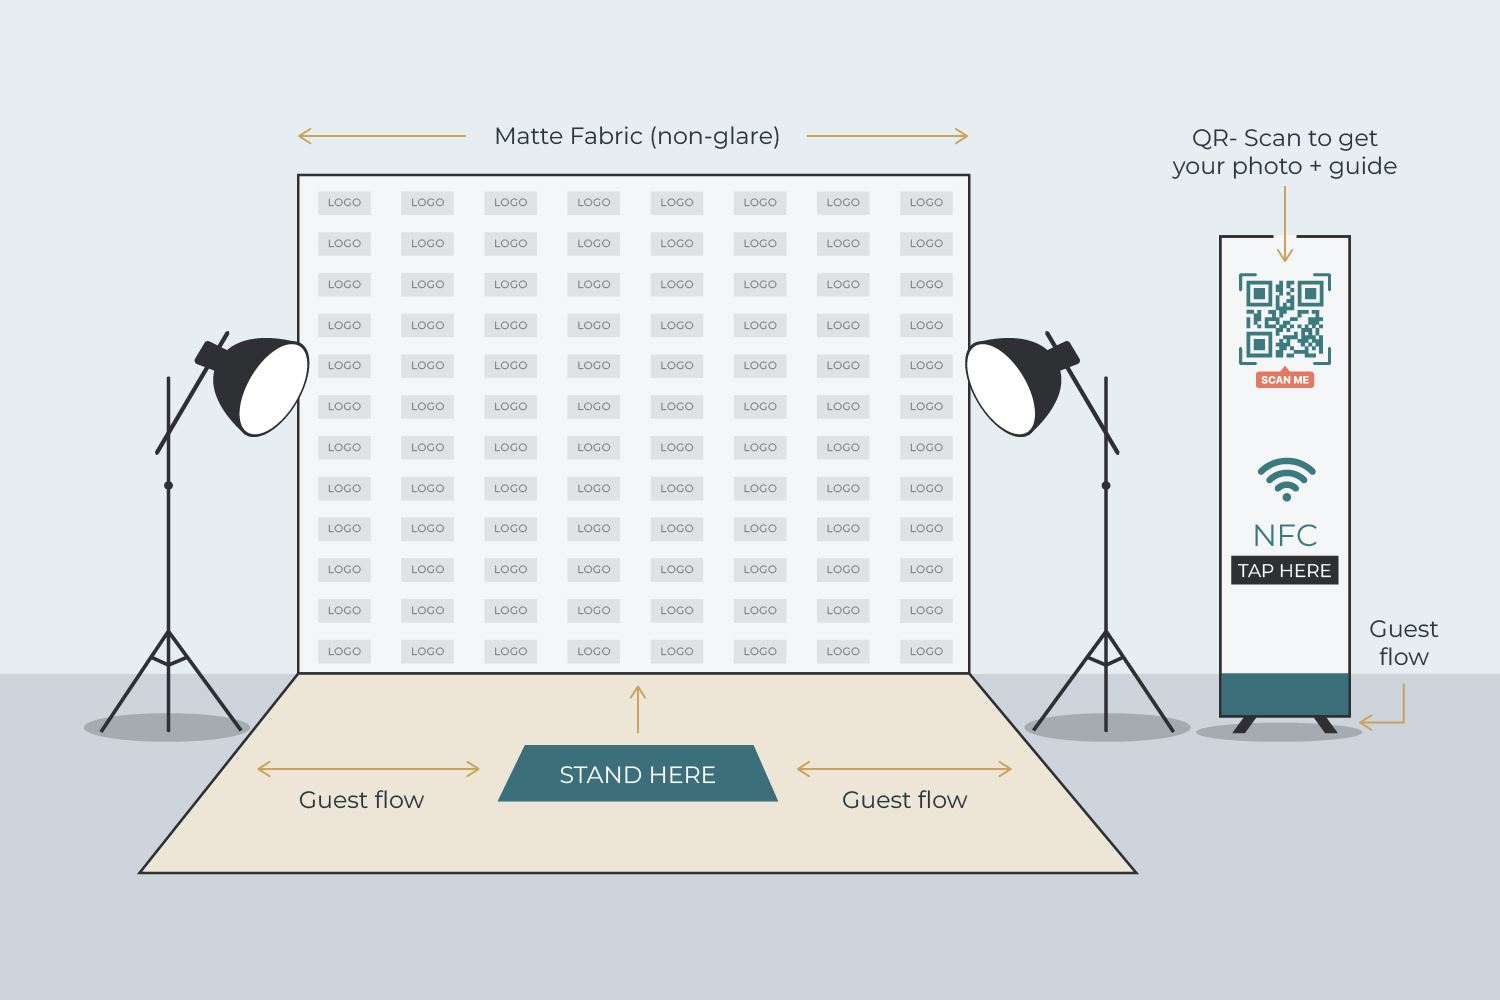
QR codes should be positioned at shoulder height and sized large enough to scan comfortably from 3-6 feet away. Place them on a side sign or counter display rather than directly on the photo backdrop to keep your branded wall visually clean.
NFC tags work brilliantly as backup options when Wi-Fi is spotty or when visitors prefer tap-to-connect. Embed these in a slim side sign with clear "Tap Here" instructions. Most modern smartphones support NFC, making this nearly as universal as QR codes.
Include a text-to-join shortcode as your final fallback method. Even when scanning fails, visitors can text a keyword to your number and receive the same landing page link via SMS reply.
Keep your on-site form to three fields maximum: name, email, and one qualifying question. Every additional field cuts conversion rates by 10-15%. Design your auto-reply to deliver their photo or promised resource within minutes, not hours, so the positive experience starts immediately while they're still at your booth.
Consider progressive profiling for follow-up emails rather than trying to collect everything upfront. You'll capture more leads initially and can gather additional qualification data through your nurture sequence.
Signage & Micro-Copy
Your main photo wall should stay visually clean and on-brand. Put all calls-to-action and instructional copy on a separate side sign, counter topper, or easel display positioned where visitors naturally look after taking their photo.
Effective micro-copy leads with value, then asks for information. Here are proven examples:
"Snap a pic. Scan to get it + our startup toolkit."
"One tap for the template pack. No spam—unsubscribe anytime."
"Get your photo + 2024 buyer's guide in 30 seconds."
The formula works because it promises immediate value (photo delivery), adds a bonus (guide, toolkit, template), and addresses the biggest objection (spam concerns) in under 10 words. Avoid generic phrases like "Learn more" or "Get started" that don't specify what visitors actually receive.
Include privacy reassurance directly in your sign copy. Simple phrases like "No spam" or "Unsubscribe anytime" reduce form abandonment and improve completion rates, especially for first-time leads who don't know your brand yet.
Workflow & Roles
Assign specific roles to avoid confusion and ensure consistent lead quality. Your Greeter manages booth flow, invites visitors to take photos, and points them toward the scanning instructions. This person controls first impressions and keeps lines moving smoothly.
The Guide/Photographer frames shots for optimal backdrop usage and prompts visitors to scan after their photo. They're responsible for the transition from photo-taking to lead capture—the most critical moment in your funnel.
Your Qualifier engages visitors during or after scanning, asks follow-up questions, and tags lead quality in your CRM or lead capture app. They determine which leads get priority follow-up and meeting attempts.
Designate one person as the Data Owner who makes real-time decisions about booth adjustments, checks tracking functionality, and runs end-of-day reporting. This role prevents the "too many cooks" problem that kills accountability.
Create a simple handoff system between roles using physical cues like clipboards, badge colors, or specific positioning. When your booth gets busy, clear workflows prevent leads from falling through cracks or getting double-contacted by multiple team members.
Landing Page & Follow-Up Cadence
Your landing page should deliver on exactly what your sign promised—nothing more, nothing less. Use the same headline copy, deliver the promised resource immediately, and include one clear next step like "Book a 15-minute demo" or "Download the full toolkit."
Design your post-event email sequence around three strategic touchpoints:
Day 0 (same day): "Here's your photo + [promised resource]" with a soft secondary CTA. This confirms delivery and maintains positive momentum while visitors still remember your booth interaction.
Day 3: Problem-solution email that references common challenges mentioned during booth conversations, plus a direct meeting booking link. This timing catches leads while the event experience is still fresh but after they've returned to normal work routines.
Day 10: Social proof or additional resource email (case study, template, tool) with a clear next step. By now, leads have processed other event follow-ups, so your message can stand out with genuine value-add content.
Include calendar booking links in every follow-up email rather than forcing leads to reply and coordinate meeting times manually. Tools like Calendly or HubSpot's meeting scheduler reduce friction and improve booking conversion rates.
Measurement Windows
Track metrics across three distinct timeframes to capture both immediate performance and longer-term pipeline impact. On-site metrics focus on daily scans, lead capture rates, and meetings booked during the event itself. These numbers guide real-time booth adjustments and staffing decisions.
Your 30-day window captures MQLs and SQLs created, meetings actually held, and initial qualification outcomes. This timeframe shows how well your booth conversations translated into sales-ready opportunities and reveals the true quality of your lead capture process.
The 90-day measurement window tracks opportunities opened, stage progression through your sales process, and influenced revenue amounts. These metrics connect your photo wall investment to actual business outcomes and justify future event budgets.
Lock in a consistent reporting schedule and owner for each measurement window before your event starts. Weekly check-ins for short-term metrics, monthly reviews for pipeline progression, and quarterly analysis for revenue impact work well for most organizations.
Don't try to measure everything perfectly—focus on the metrics that directly connect to your primary success goal defined in step one.
Dashboard Setup
Create a simple spreadsheet or CRM report with these essential columns: Date, Venue, Booth Location, UTM Parameters, Visits, Leads Captured, Lead Source, Qualification Score, Meetings Booked, MQL Count, SQL Count, Opportunity ID, and Notes.
Build two separate dashboard views: one for daily operations (on-site team) and another for pipeline analysis (sales leadership). Your operations view should emphasize real-time metrics like hourly scan rates and lead capture conversion, while your pipeline view focuses on meeting outcomes and revenue stage progression.
Save filtered views for each UTM variant to compare performance between different sign designs, messaging approaches, or booth placements. This comparison data guides optimization decisions for future events and helps you double down on what actually works.
Export raw data weekly rather than relying on platform dashboards that might change or lose historical information. Your spreadsheet backup ensures you can analyze trends across multiple events and maintain consistent measurement approaches.
Attribution Without the Headache
Pick one attribution model upfront and stick with it consistently. Last-touch attribution works well for simplicity and gives your photo wall credit when it directly precedes conversion. First-touch attribution better shows sourcing impact when you have longer sales cycles with multiple touchpoints.
If your team wants to track both models, report them side-by-side and clearly explain the difference on every dashboard and presentation slide. Mixing attribution models in the same analysis creates confusion and undermines confidence in your measurement approach.
Use identical UTM parameters across all photo wall placements—main backdrop, side signs, counter tablets, or handout materials. Consistent tagging enables clean aggregation and prevents attribution fragmentation that makes performance analysis impossible.
Document your attribution decision and measurement approach in writing. When team members change or new people join your measurement process, written standards prevent methodology drift that ruins historical comparison capabilities.
Data Hygiene & Consent
Include a plain-English consent statement on your scanning sign, positioned where visitors can easily read it but outside the photo frame. Simple language like "By submitting your info, you agree to receive helpful emails from [Company]" satisfies most compliance requirements without legal jargon.
Standardize required form fields and use consistent picklist values to prevent duplicate records and data quality issues. Create dropdown menus for fields like company size, industry, or role rather than allowing free-text entry that creates inconsistent categorization.
Run nightly data de-duplication, tag every new record with your event name and date, and archive raw scanning data separately from qualified lead records. This process maintains clean CRM data while preserving detailed analytics information for future analysis.
Store consent timestamps alongside lead source information and respect opt-out requests immediately. Good data hygiene practices build trust with leads and reduce compliance risk while maintaining the measurement accuracy you need for ROI analysis.
Iteration Plan (A/B Ideas)
Test backdrop design elements like QR code tile size, color contrast, and placement position to improve scanning rates and photo crop quality when visitors share on social media. Small design changes often yield big improvements in both functionality and visual appeal.
Compare QR versus NFC placement effectiveness, or test different incentive copy approaches like "Get your photo" versus "Get the toolkit" to see which value proposition drives higher conversion rates.
Experiment with landing page hero messages that emphasize different benefits. Photo delivery might work better for consumer audiences, while professional toolkits or buyer's guides could perform better for B2B events.
Adjust your qualification questions based on SDR feedback about lead quality and handoff effectiveness. Sometimes small changes in how you ask about timeline or budget can dramatically improve meeting show rates and sales team satisfaction.
Pre-Show Checklist
- Goals defined and numeric targets set
- UTM parameters created and tested
- Landing page built and form tested
- Auto-reply email sequence activated
- Sign designs approved and printed
- Scanning hardware (tablets, NFC tags) configured
- Team roles assigned with backup coverage
- Data owner designated for daily reporting
Show Day Checklist
- Test complete scan-to-email workflow
- Confirm form submission and auto-reply delivery
- Daily KPI targets posted visibly at booth
- Team briefed on qualification criteria
- Backup scanning methods ready (NFC, text code)
- Real-time tracking dashboard accessible
- End-of-day reporting schedule confirmed
Post-Show Checklist
- Export all lead data and UTM analytics
- De-duplicate records and tag with event source
- Launch follow-up email sequence
- Schedule SDR handoff meetings
- Begin qualification scoring process
- Set 30-day and 90-day measurement calendar reminders
Frequently Asked Questions
Where should the QR code live?
Place QR codes on a separate side sign or counter display rather than directly on your photo backdrop. This keeps your branded wall visually clean while positioning the code at an optimal height and angle for easy scanning.
How many fields should the form have?
Stick to three fields maximum: name, email, and one qualifying question. Every additional field reduces conversion rates by 10-15%, so use progressive profiling through follow-up emails to gather additional information.
What if show Wi-Fi is unreliable?
Include NFC tags as a backup option for tap-to-connect functionality, plus a text-to-join shortcode as your final fallback. This ensures visitors can still convert even when network connectivity is poor.
Do we need separate links for each day?
Use one primary link with different UTM parameters to segment performance by day, booth location, or design variant. This approach simplifies management while maintaining detailed tracking capabilities.
How do we track social shares from the wall?
Monitor branded hashtags, location tags, and @mentions across platforms. Calculate share rate by dividing tagged social posts by total photos taken (estimated from booth traffic or direct observation).
Which attribution model should we pick?
Choose last-touch for simplicity and direct conversion credit, or first-touch for sourcing impact measurement. Stick consistently with one model to maintain clean historical comparisons and avoid confusion in reporting.
Ready to turn your next photo wall into a lead generation powerhouse? Contact our team with your event details, and we'll help you design the complete measurement framework—from UTM setup to dashboard creation—that proves real ROI from every selfie.